 Optical Materials Optical Materials |
Pulse Propagation in Waveguides |
|||||||||||||||||||||||||||||||||||||||||||
|
Numerical Simulation Description: When a short pulse ranging from nanoseconds to femtoseconds propagates in a waveguide, both dispersive and nonlinear effects influence its shape and spectrum. The pulse evolution is governed by the nonlinear Schrodinger equation (NLSE): |
||||||||||||||||||||||||||||||||||||||||||||
 Fiber Optic Components Fiber Optic Components |
||||||||||||||||||||||||||||||||||||||||||||
 Light Sources & Photodiodes Light Sources & Photodiodes |
||||||||||||||||||||||||||||||||||||||||||||
 Spectrometers Spectrometers |
||||||||||||||||||||||||||||||||||||||||||||
 Wafers Wafers |
where
The NSL equation is a nonlinear partial differential equation that does not have an analytical solution except for some specific cases. A numerical approach is often necessary to understand both dispersive and nonlinear effects. One widely used method to solve NSL equation is the split-step Fourier method. The split-step Fourier method separates the operator into a differential operator and a nonlinear operator in the form.
where
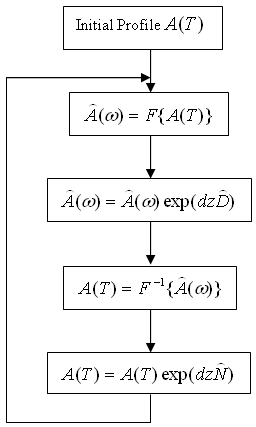
In general, the dispersion and nonlinear effects act together along the waveguide. The split-step Fourier method assumes that the dispersion and nonlinear effects can be pretended to act independently over a small distance dz. More specifically, pulse propagation form z to z+dz is carried out in two steps. The nonlinearity acts alone in the first step while the dispersive effect act alone in the second step indicated in figure 1 flow diagram.
Features:
Example 1: Dispersion and Chirp Effects
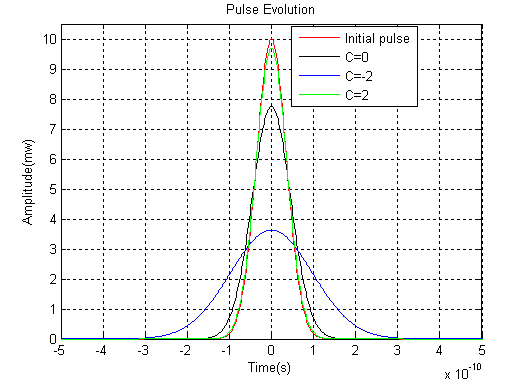
The red color shows an incident pulse at z=0 while the black color shows the pulse broadening induced from dispersion. The pulse is narrowed initially when the product of the second-order propagation constant and the chirp parameter is less than zero. When the pulse propagates further, the pulse starts to broaden and the green color shows the pulse width is almost same with the incident pulse after 100km propagation. The blue color indicates a fast broadening for the product which is greater than zero. Example 2: Third-order Dispersion Effect
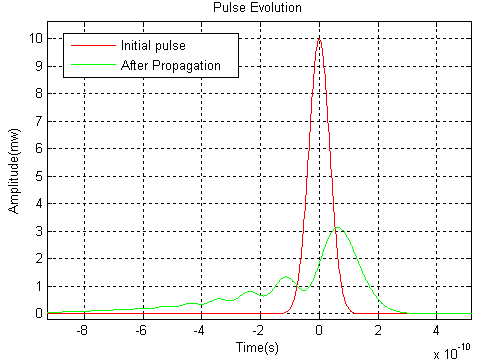
When the third order dispersion (TOD) length is smaller than or at the same scale with the dispersion length, the third order dispersion is not negligible. Example 3: Interplay between Group Velocity Dispersion (GVD) and Self-phase Modulation
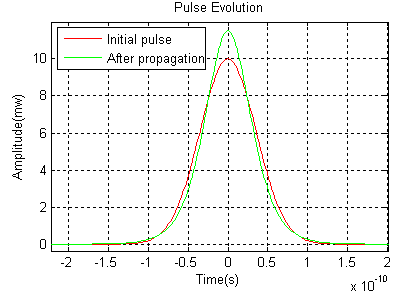
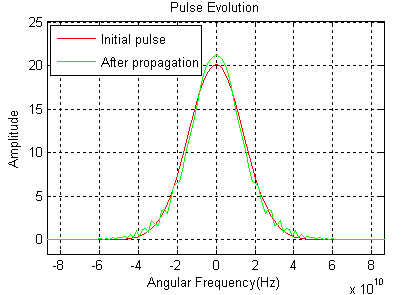
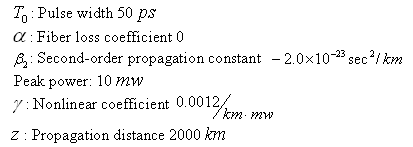
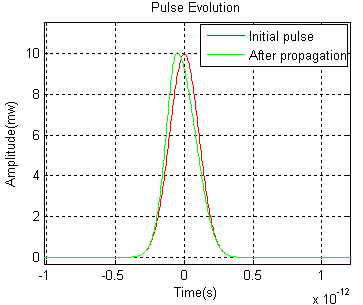
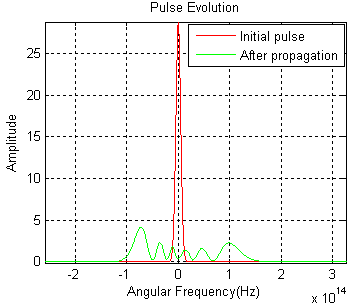
When GVD fully compensates the effect of self-phase modulation, an optical pulse of prescribed intensity and shape propagates in a nonlinear and dispersive medium without altering its shape. Figure 4 shows a Soliton-like pulse evolution in both time and frequency domains. Example 4: Self-steepening Effect
Self-steepening creats an optical shock on the trailing edge of an optical pulse without the GVD effect. It is due to the intensity dependent group velocity that results in the peak pulse traveling slower than the wings. Example 5: Cross-phase Modulation
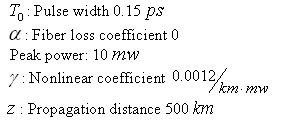
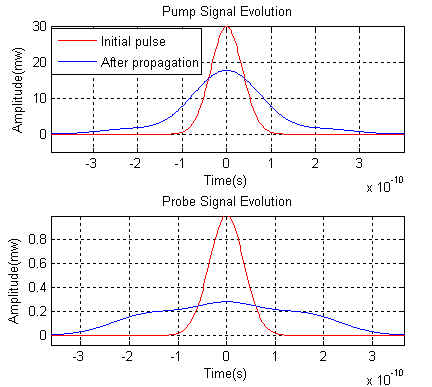
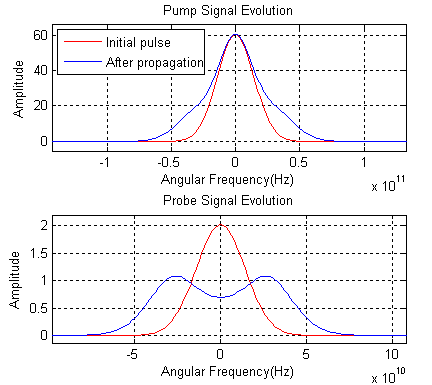
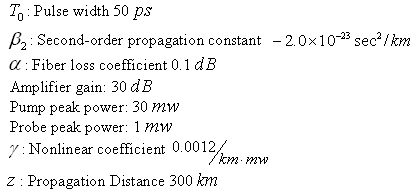
Figure 6 shows both pump and probe pulses’ evolution and assumes both pulses have same polarization without walk-off effect. The probe pulse experiences a much bigger broadening in both time and frequency domains induced by cross-phase modulation. |
|||||||||||||||||||||||||||||||||||||||||||
|
|
||||||||||||||||||||||||||||||||||||||||||||
Copyright © 2016 Precision Micro-Optics Inc. All Rights Reserved.


